
Filter By

About Tech Bootcamps
Are Bootcamps Worth It in 2026? Real ROI, Costs, and Outcomes
Thinking about a coding bootcamp? Explore real ROI for Fullstack Academy—tuition, salaries, payback time, and career outcomes.
Read more

Tech Career Advice
Top 14 Cities for Tech Roles in 2026
In the fast-paced world of technology, 2026 holds the potential for an array of opportunities for tech professionals. Choosing the right city can significantly impact your tech career, job availability, salary, and overall professional growth.
Read more

Tech Career Advice
16 Highest-Paying Tech Careers in 2026
Explore the highest-paying tech careers in 2026. Discover top-paying tech jobs, salaries, and skills needed. Start your journey with Fullstack Academy.
Read more

Data Analytics
Is Data Analytics Hard? What Beginners Should Know
Is data analytics hard to learn? Discover the real challenges, skills you need, and practical tips to start a career in data analytics—even as a beginner.
Read more

Data Analytics
Data Engineer Roadmap: Skills, Tools & Learning Path to Get Hired
Discover a practical data engineer roadmap with the skills, tools, certifications, and self-learning path needed to become job-ready.
Read more

Tech Career Advice
5 Ways to Get Ahead in Your Career This Summer (2026)
Discover five practical ways to advance your career this summer, from building AI-ready skills and networking to updating your resume and setting career goals.
Read more

Tech Career Advice
What to Look For In a Remote Job
Not all remote jobs are the same. Learn how to evaluate remote work opportunities, compare flexibility options, and find a remote-friendly career path.
Read more

Success Stories
From AI Uncertainty to AI Confidence: Angela Kwok's AI Bootcamp Experience
Software engineer Angela Kwok shares how Fullstack Academy's AI & Machine Learning Bootcamp helped her build AI skills, expand her career goals, and gain confidence in the age of AI.
Read more

Tech Career Advice
Why Summer is a Great Season to Start a Tech Bootcamp
Summer can be a great time to build tech skills, complete hands-on projects, and prepare for a career change.
Read more

Tech Career Advice
12 Mental Health Tips for Tech Professionals (Avoid Burnout in 2026)
Mental health tips for tech professionals: 12 ways to manage stress, prevent burnout, and improve work-life balance in 2026.
Read more

Tech Career Advice
10 High-Paying Tech Jobs Without Coding
Interested in a tech career without learning to code? Explore 10 in-demand tech jobs, average salaries, required skills, and career paths for 2026.
Read more
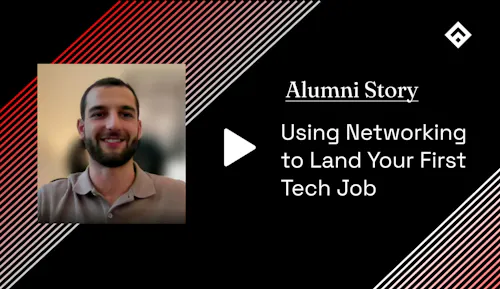
Success Stories
How Networking Enabled One Veteran Alum to Land His First Tech Job
Fullstack Academy alum and US Military veteran, Marco Pigna, shared in a recent workshop his compelling story about landing his first tech job through networking.
Read more